DataJarvis (prev. Kingfisher)
LLM-powered autonomous agent system for data workflows
Reliable SQL generation for industrial data workflows
Developed during a Microsoft STCA internship (Mar.–Oct. 2024), DataJarvis addresses the difficulty of generating long, complex SQL queries reliably with 2024-era LLMs.
- Agent–SQL protocol: Designed a protocol that gives the agent visibility into the database environment and supports database interaction.
- Reliability: Combined reasoning, tool use, execution feedback, and self-criticism to improve SQL generation reliability.
- Production impact: Integrated into Copilot data management for distributed Spark databases, reducing analysis time from 1–2 days to 20 minutes.
DataJarvis Demo Video
Watch DataJarvis in action! This demonstration showcases the core capabilities of our LLM-powered autonomous agent system for data workflows.
Experience the power of DataJarvis: from natural language queries to automated data analysis and visualization
Basic Functions: Chart Generation & Data Explanation
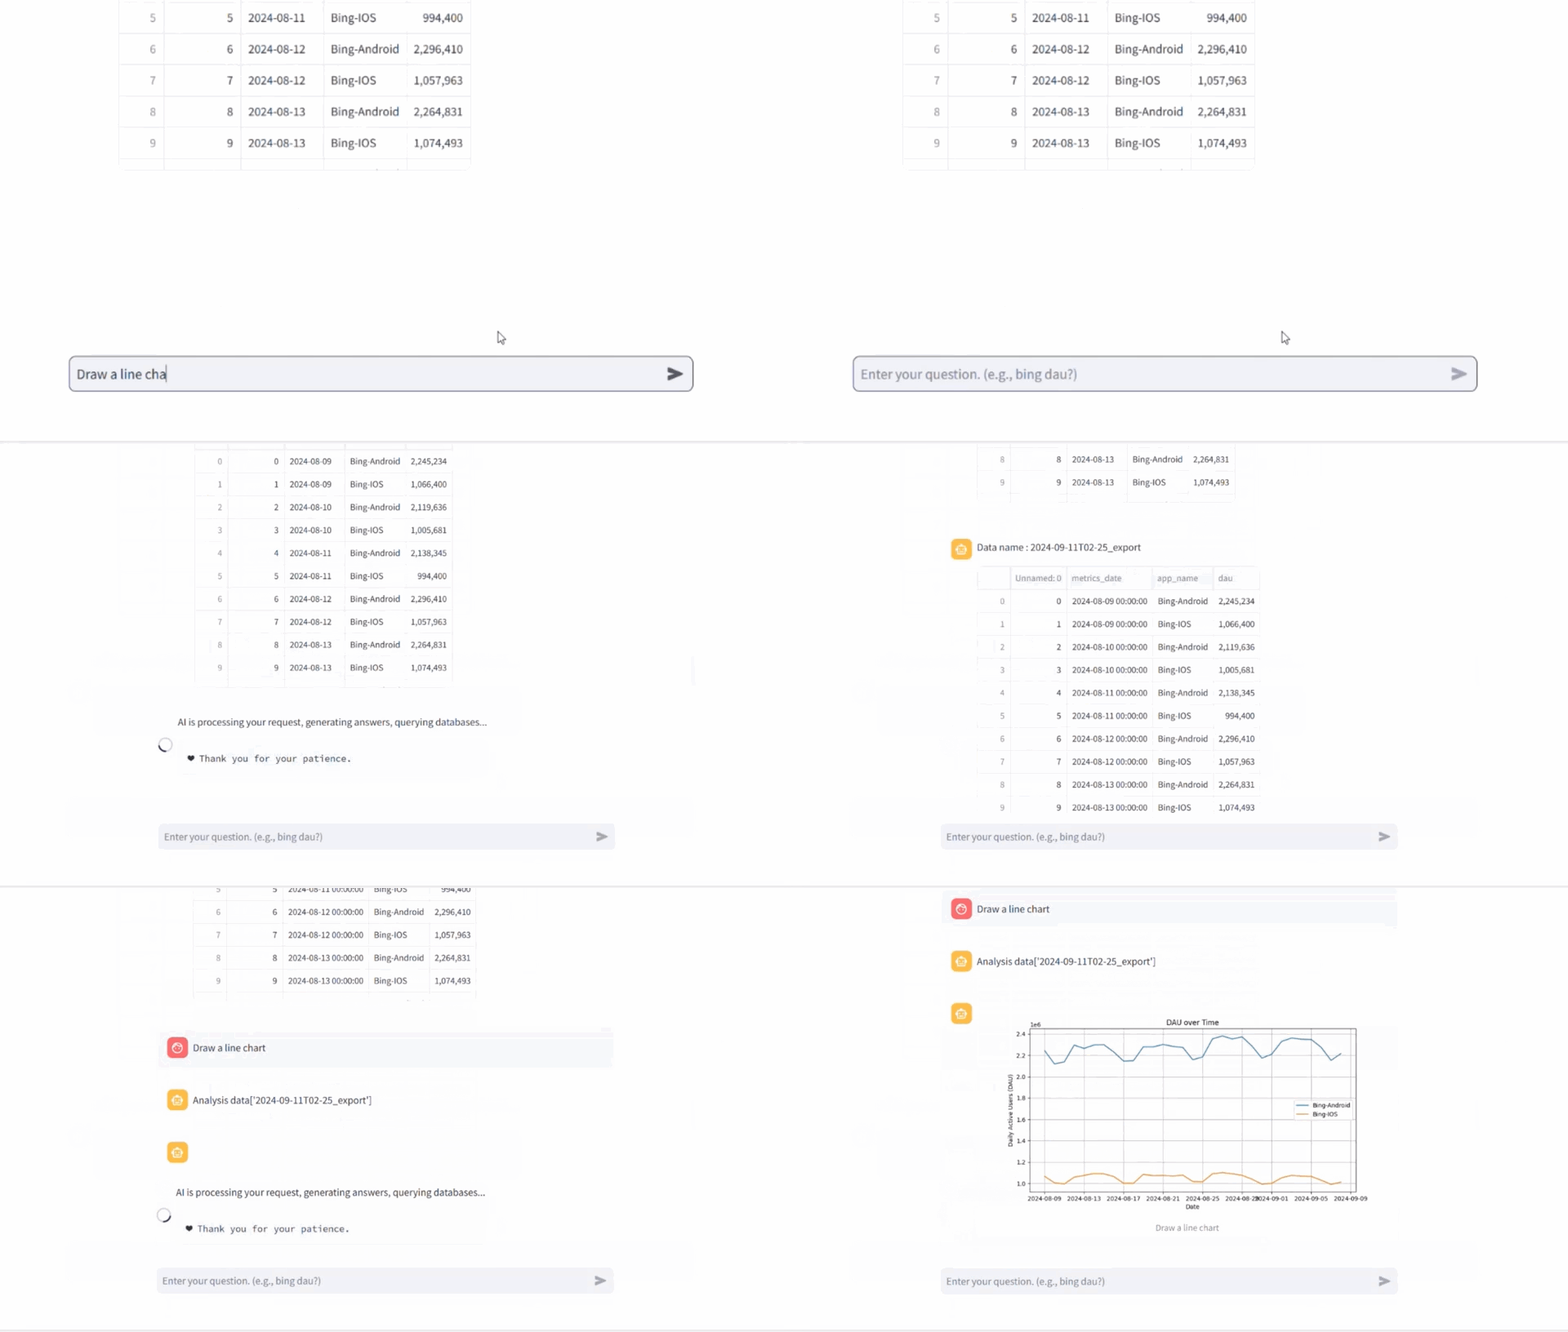
Line Chart Generation
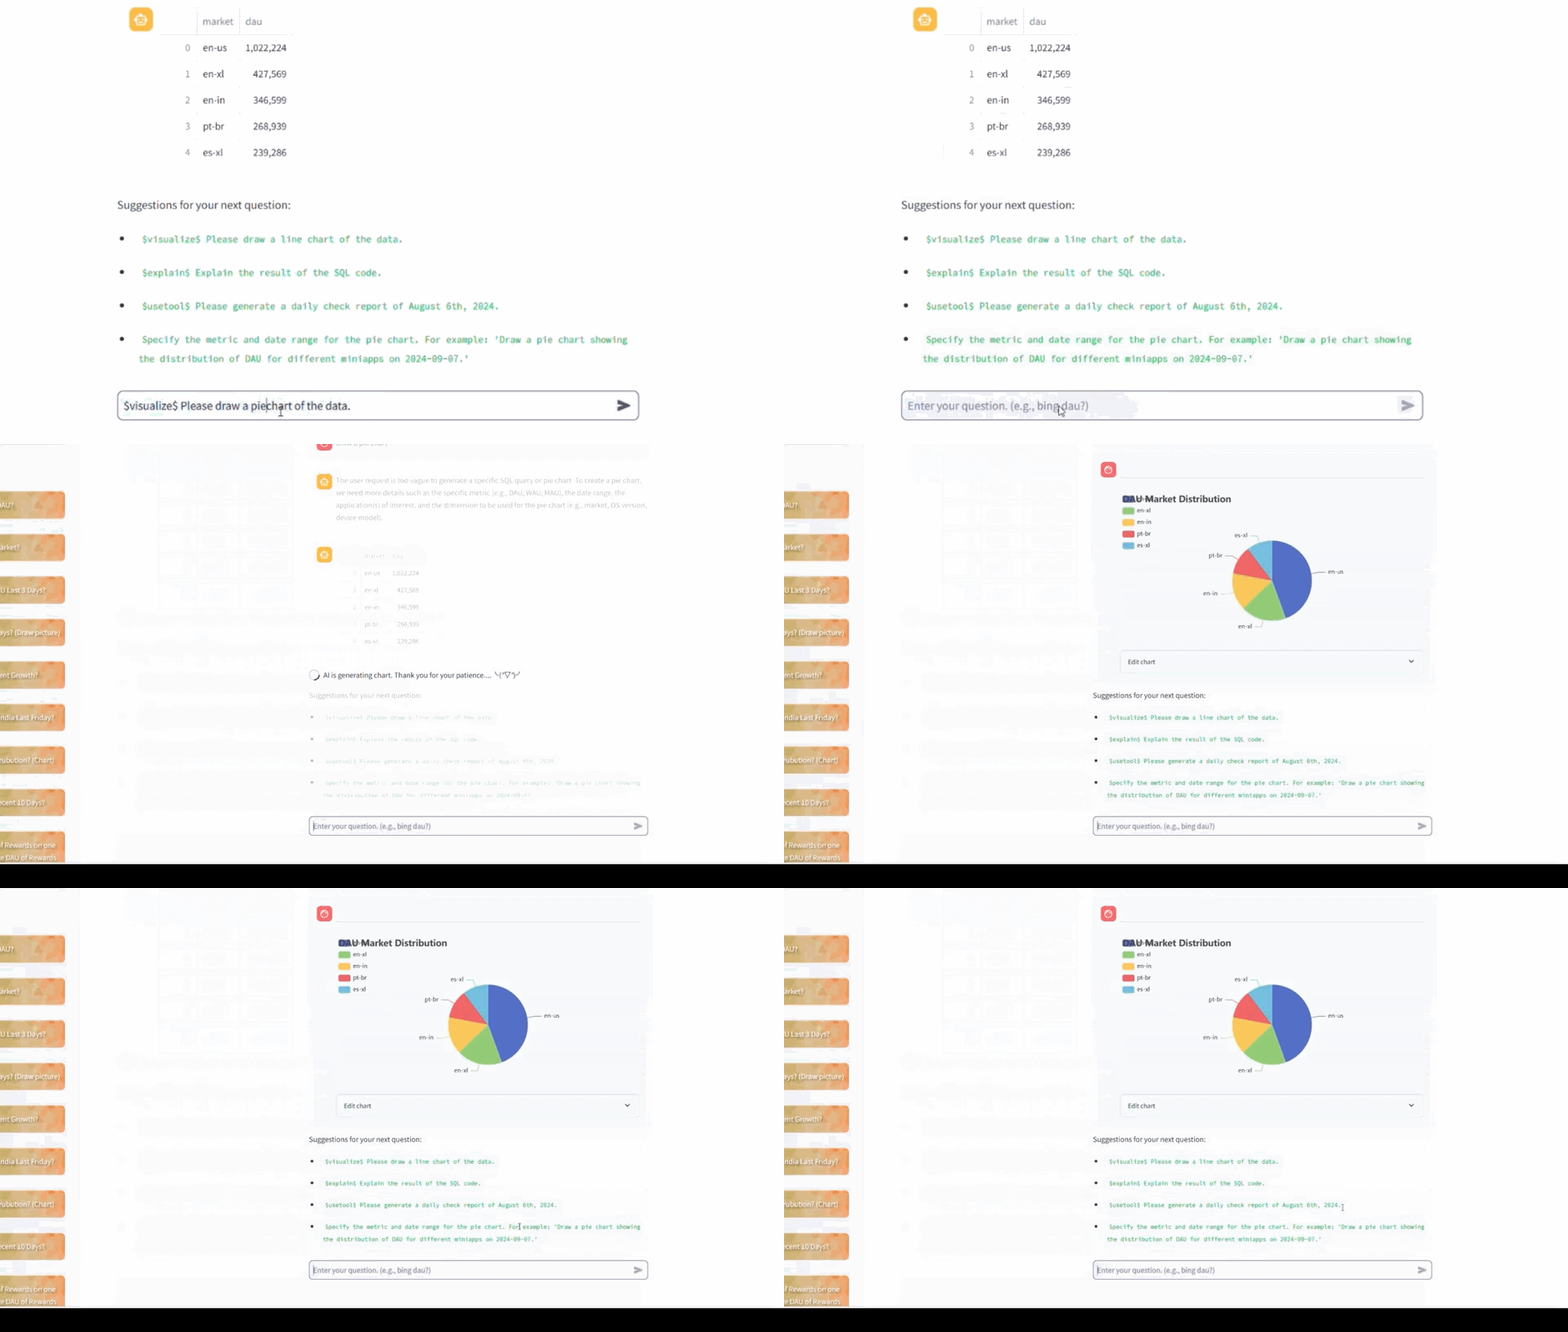
Pie Chart Generation
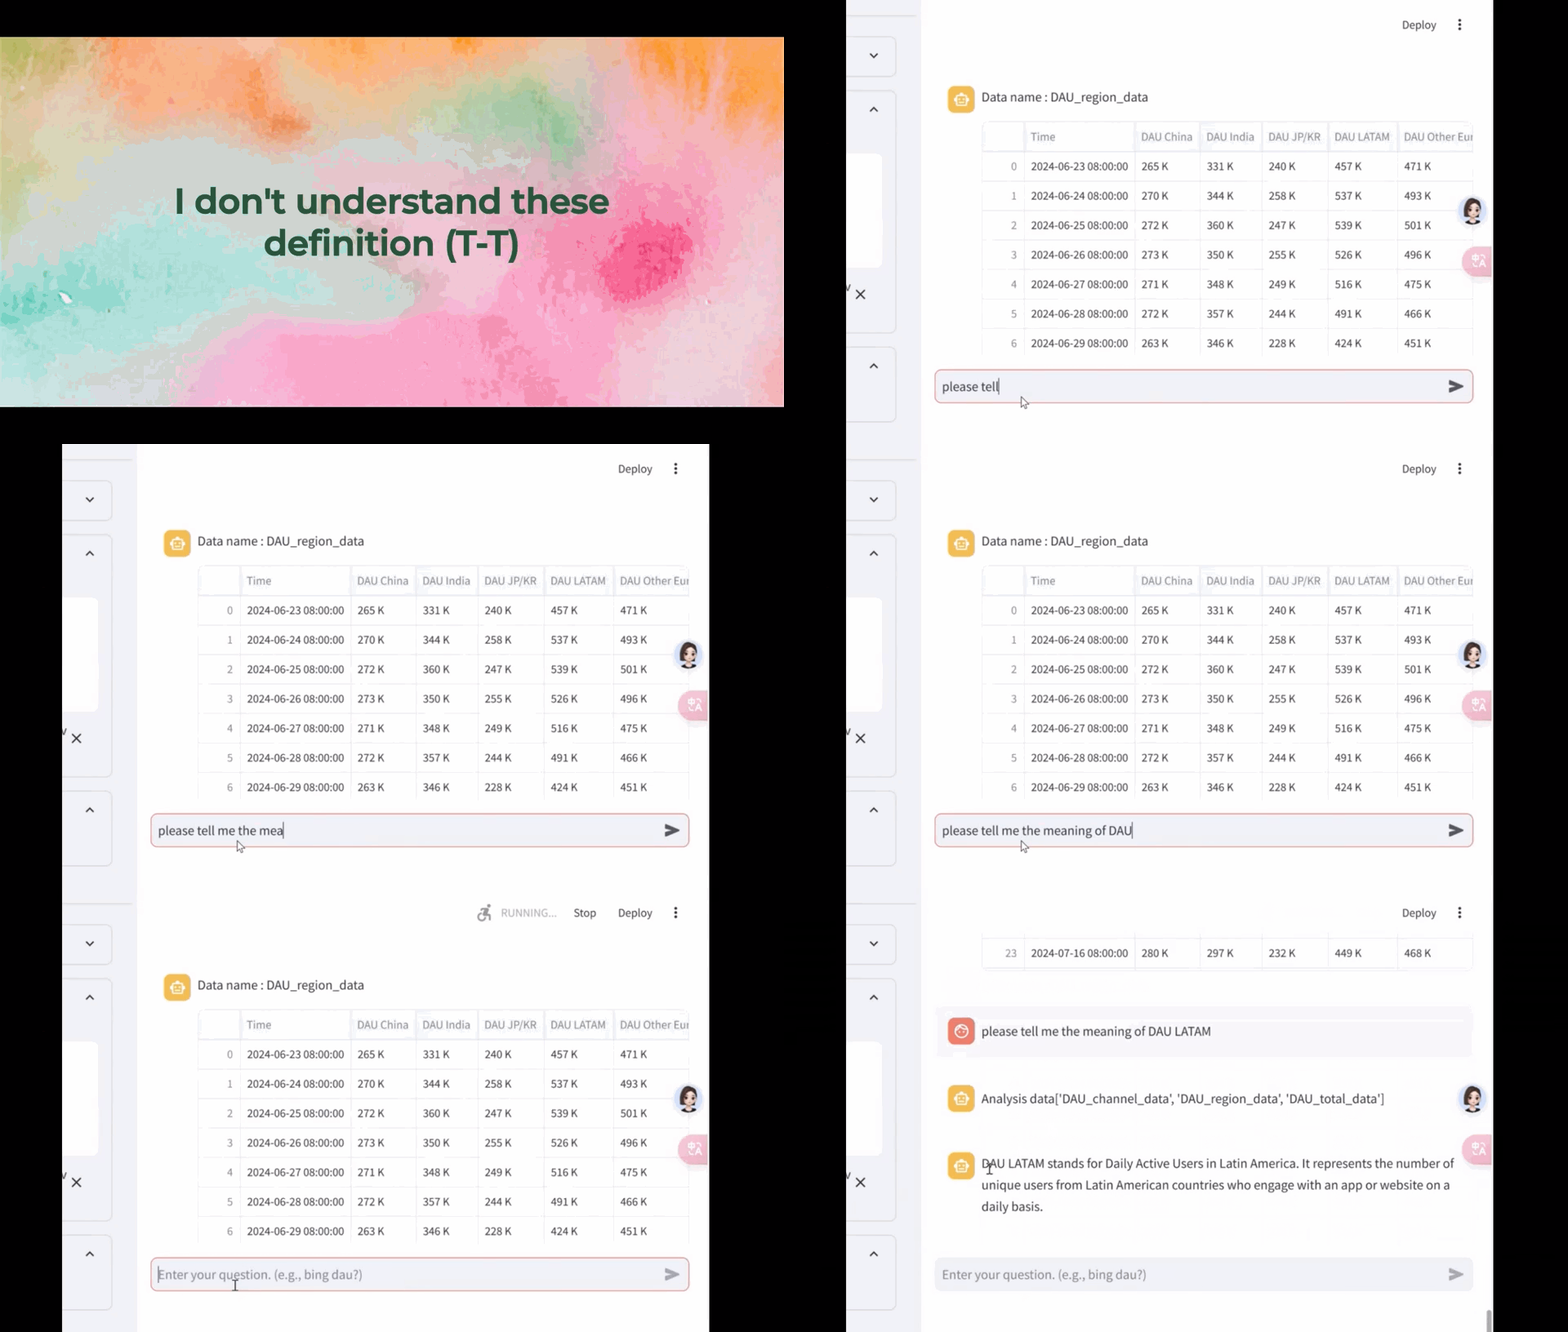
Data Explanation
Advanced Functions: Tool Usage & Visualization
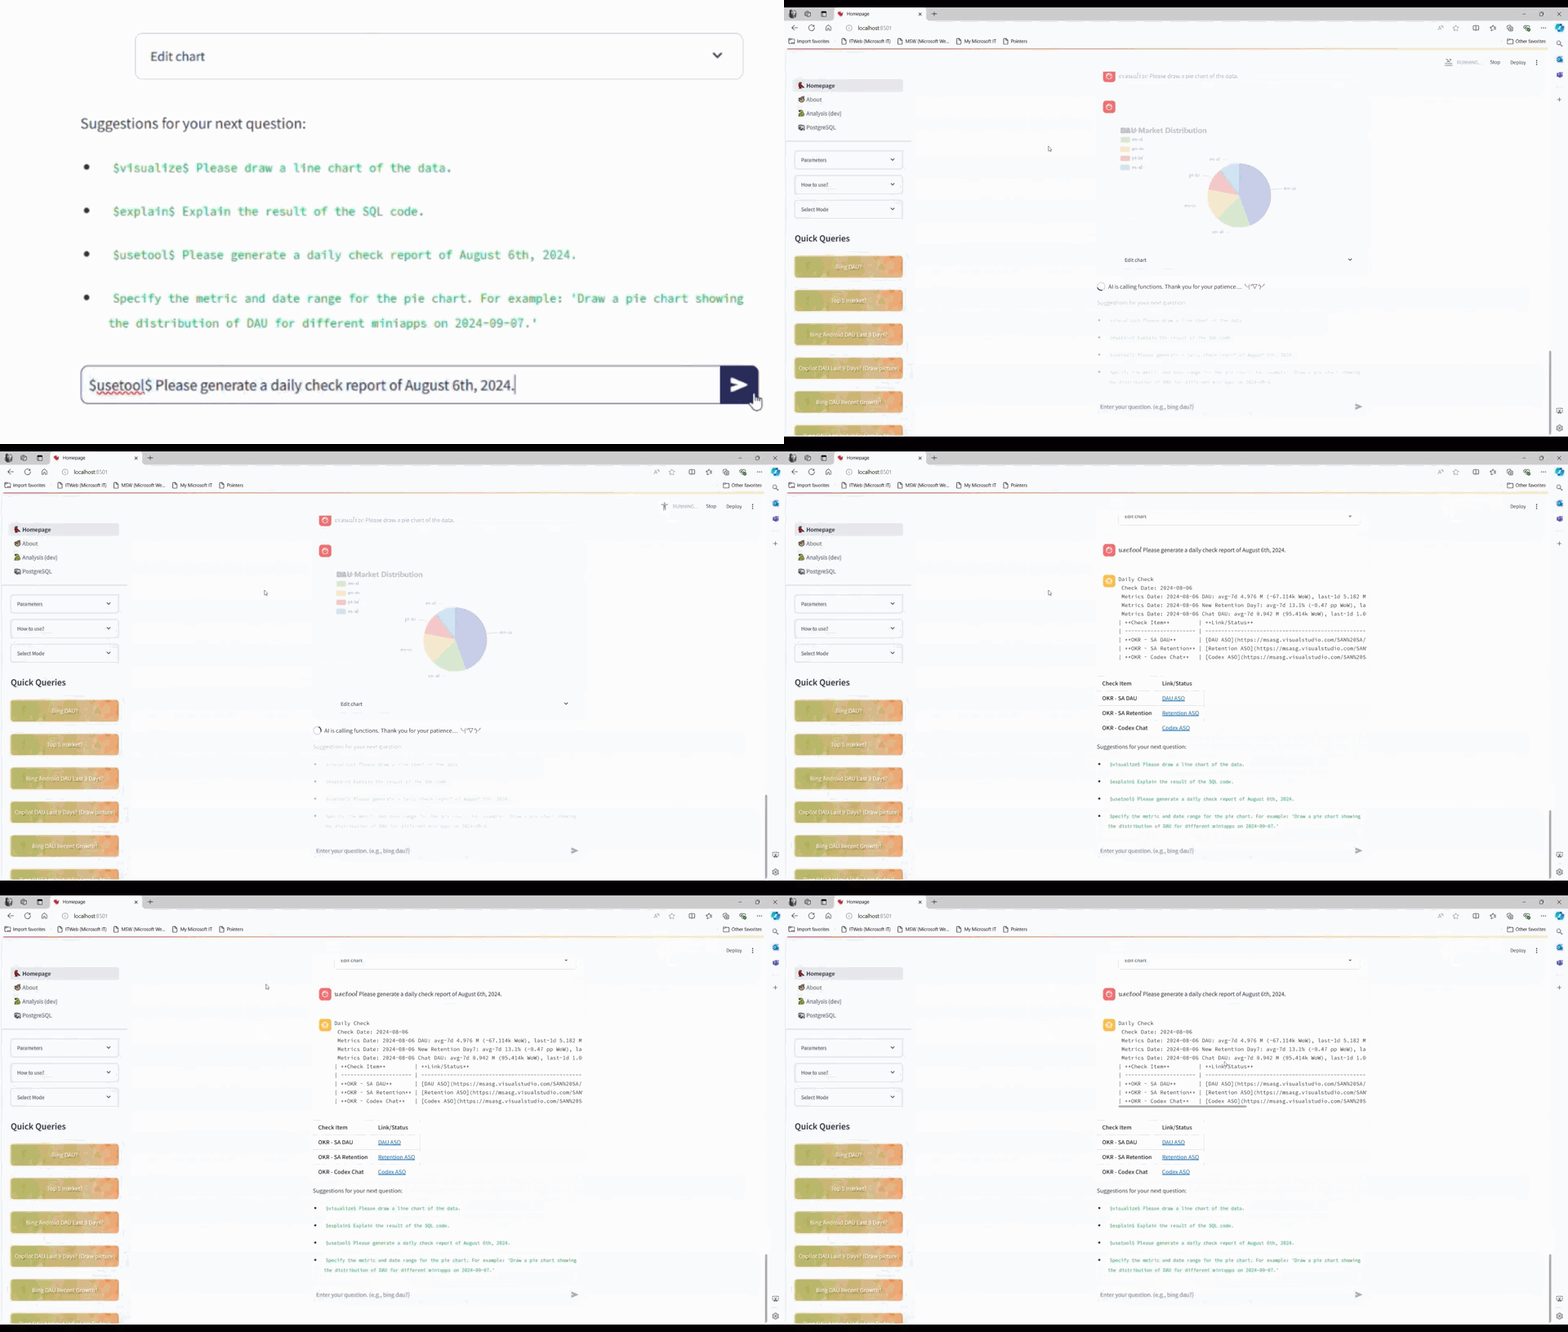
Daily Report Generation

Tool User Interface
Tool Creation & Usage: Maker & Visual Integration
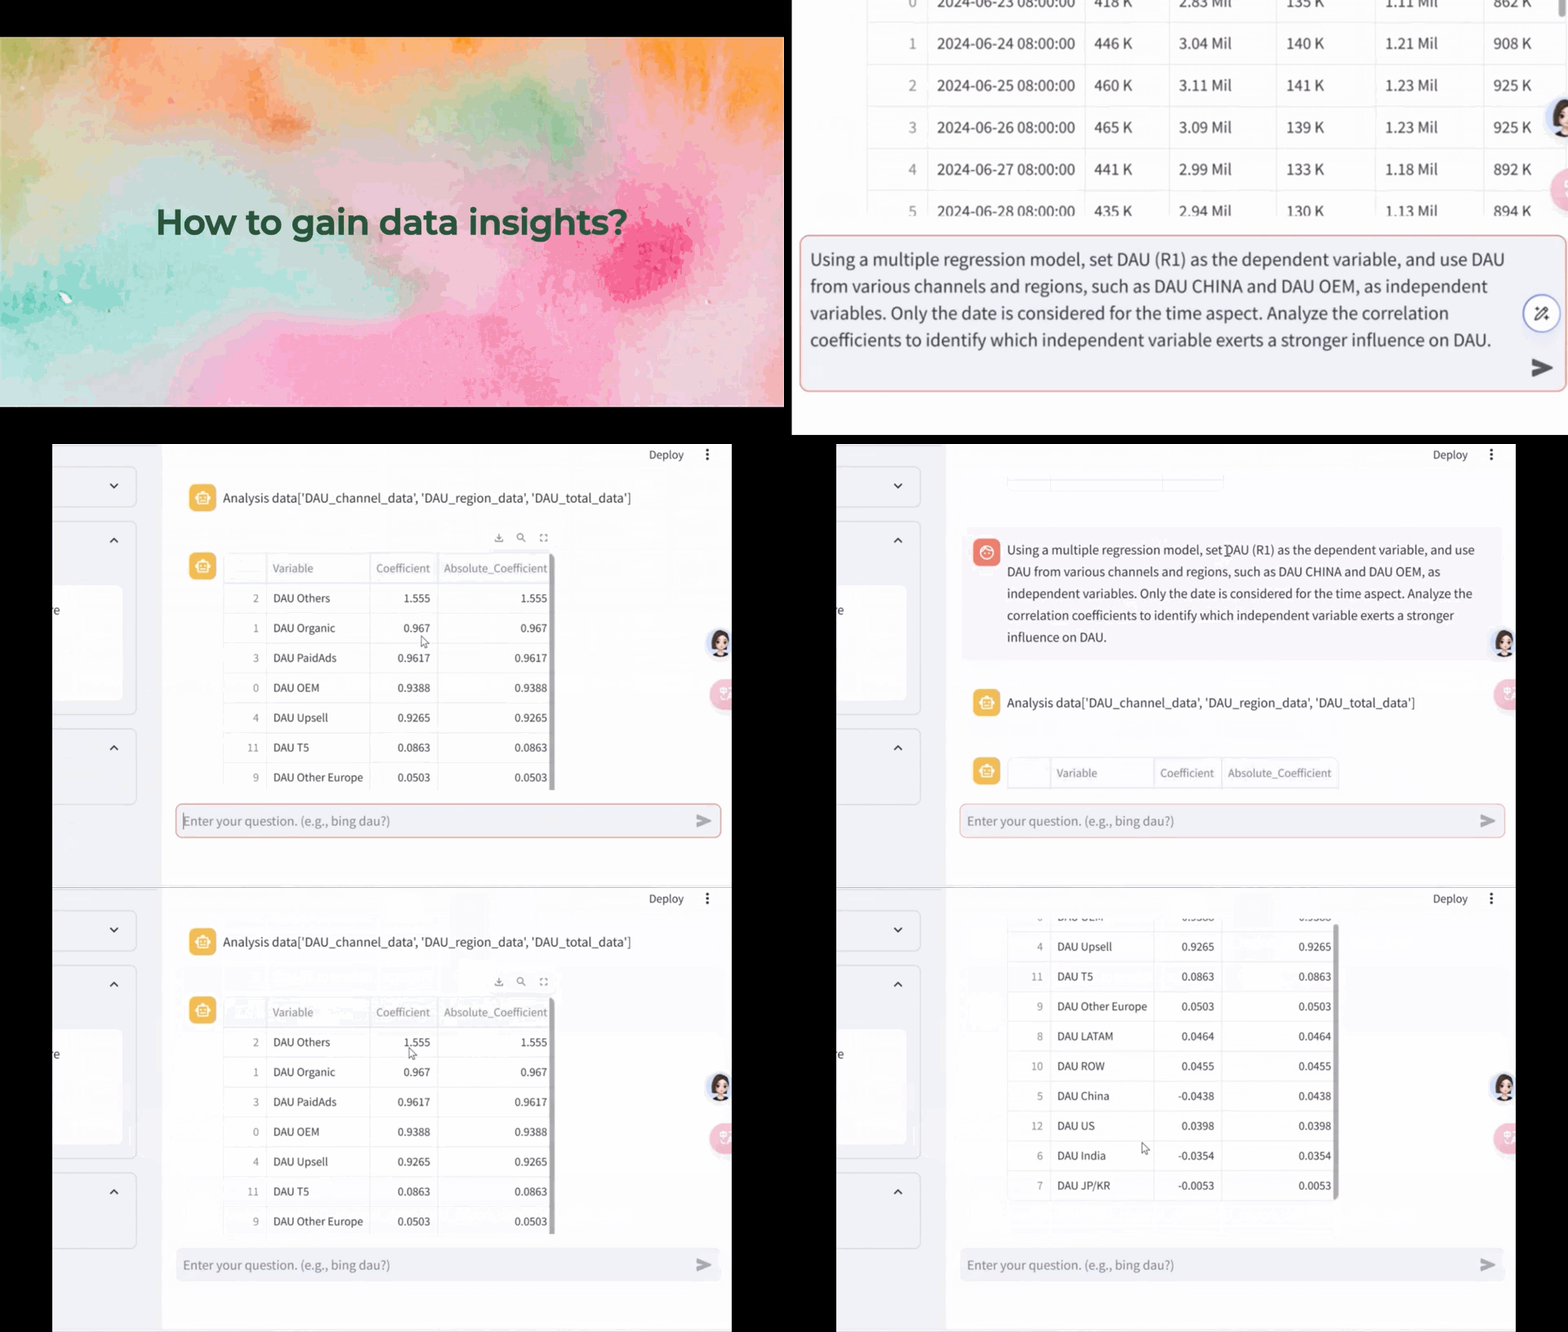
Tool Creation Process
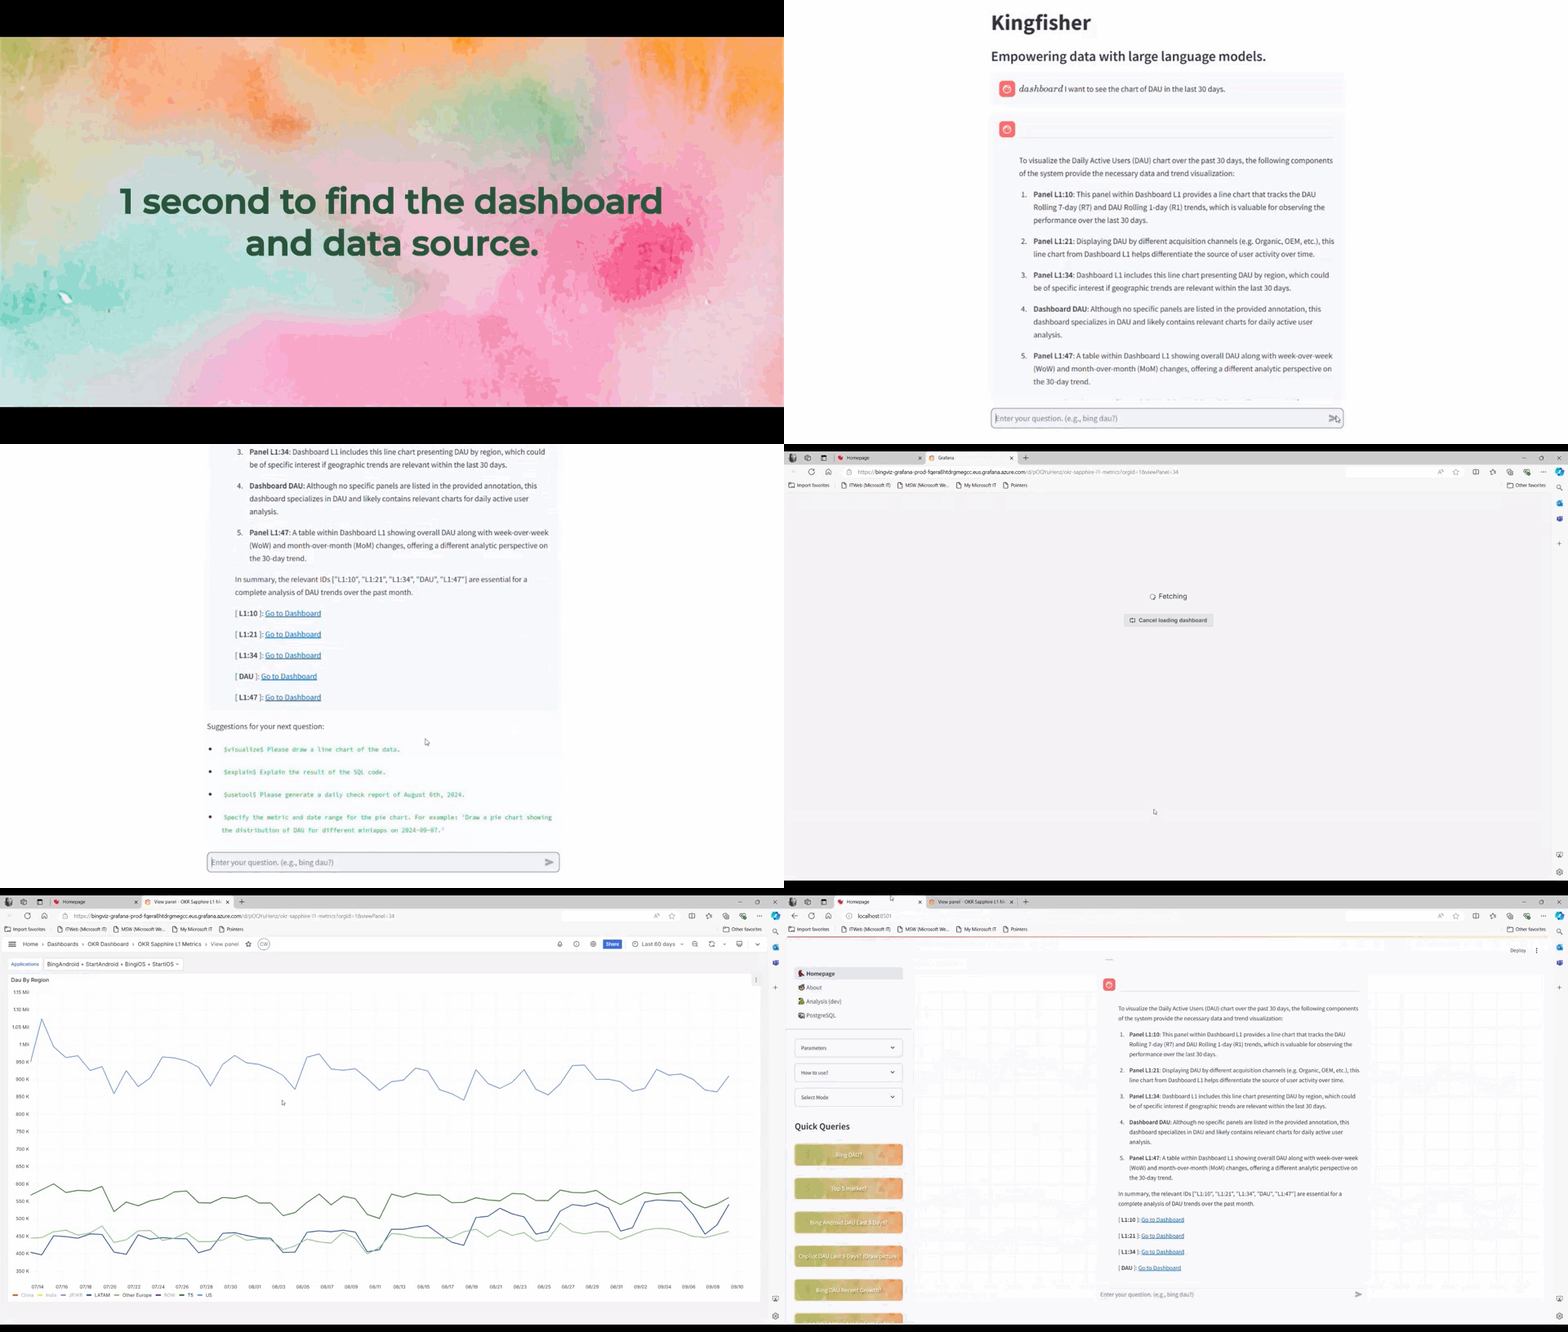
Visual Tool Integration
Agent → Agent Flow → DataJarvis
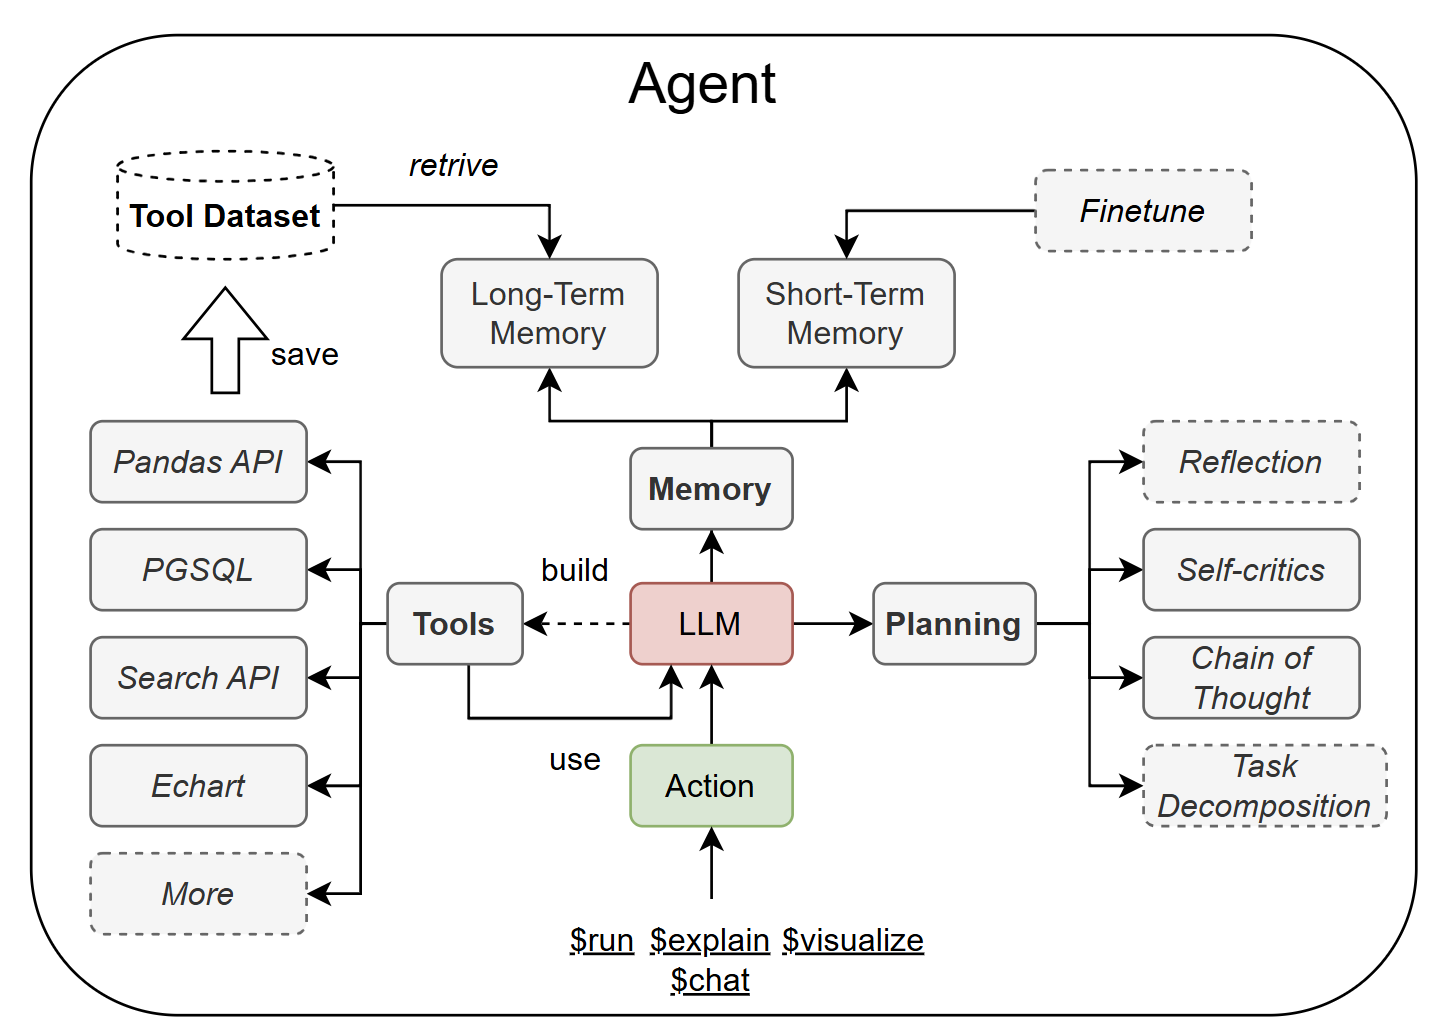
Agent is the fundamental unit of DataJarvis. The LLM (e.g., Copilot / GPT-4) functions as the agent’s brain, integrated with memory, tools and a planning framework. An agent can be used to solve an atomic task in a specific field (e.g., PGSQL code generation, draw bar chart).
For a complicated task, multiple agents constitute an agent flow, where data moves from upstream to downstream. A complicated task is decomposed into many atomic tasks and assigned to various agents in the flow. The agents share tools and memory. The agent flow is a pipeline framework that solves a complex problem step by step — a powerful general problem solver.
Agent Overview
Agent = LLM + Planning + Tools + Memory
Planning
- Chain of Thought (CoT; Wei et al. 2022): the LLM generates step-by-step reasoning to guide complex code generation. Agents in DataJarvis follow the ReAct (Yao et al. 2023) framework, adhering to a think → action → observation loop. (Done)
- Task decomposition: the agent breaks down large tasks into smaller, manageable subgoals. (Done, Auto reasoning - TODO)
- Reflection and refinement: the agent performs self-criticism and reflection (Shinn & Labash 2023), learns from mistakes, and improves future steps. (Done)
Memory
- Short-term memory: the code generation agent will be finetuned on local PGSQL dataset from Grafana. (SQL exported, waiting training)
- Long-term memory: tools and knowledge are stored for RAG (Lewis et al. 2021) and tool learning (Paranjape et al., 2023).
How Graph RAG Constructs Vectors
- Data Retrieval: retrieve relevant data from a knowledge base.
- Data Integration: integrate retrieved data with the input context.
- Vector Generation: generate high-quality vectors representing entities and relations.
Tool use & Tool build
- Tool-learning (Qin et al., 2023): learn to call external APIs for missing knowledge, including local information (Bingviz SQL Table/Wiki), code execution (PGSQL & Python), and access to open-source tools (ECharts / Pandas). (Done)
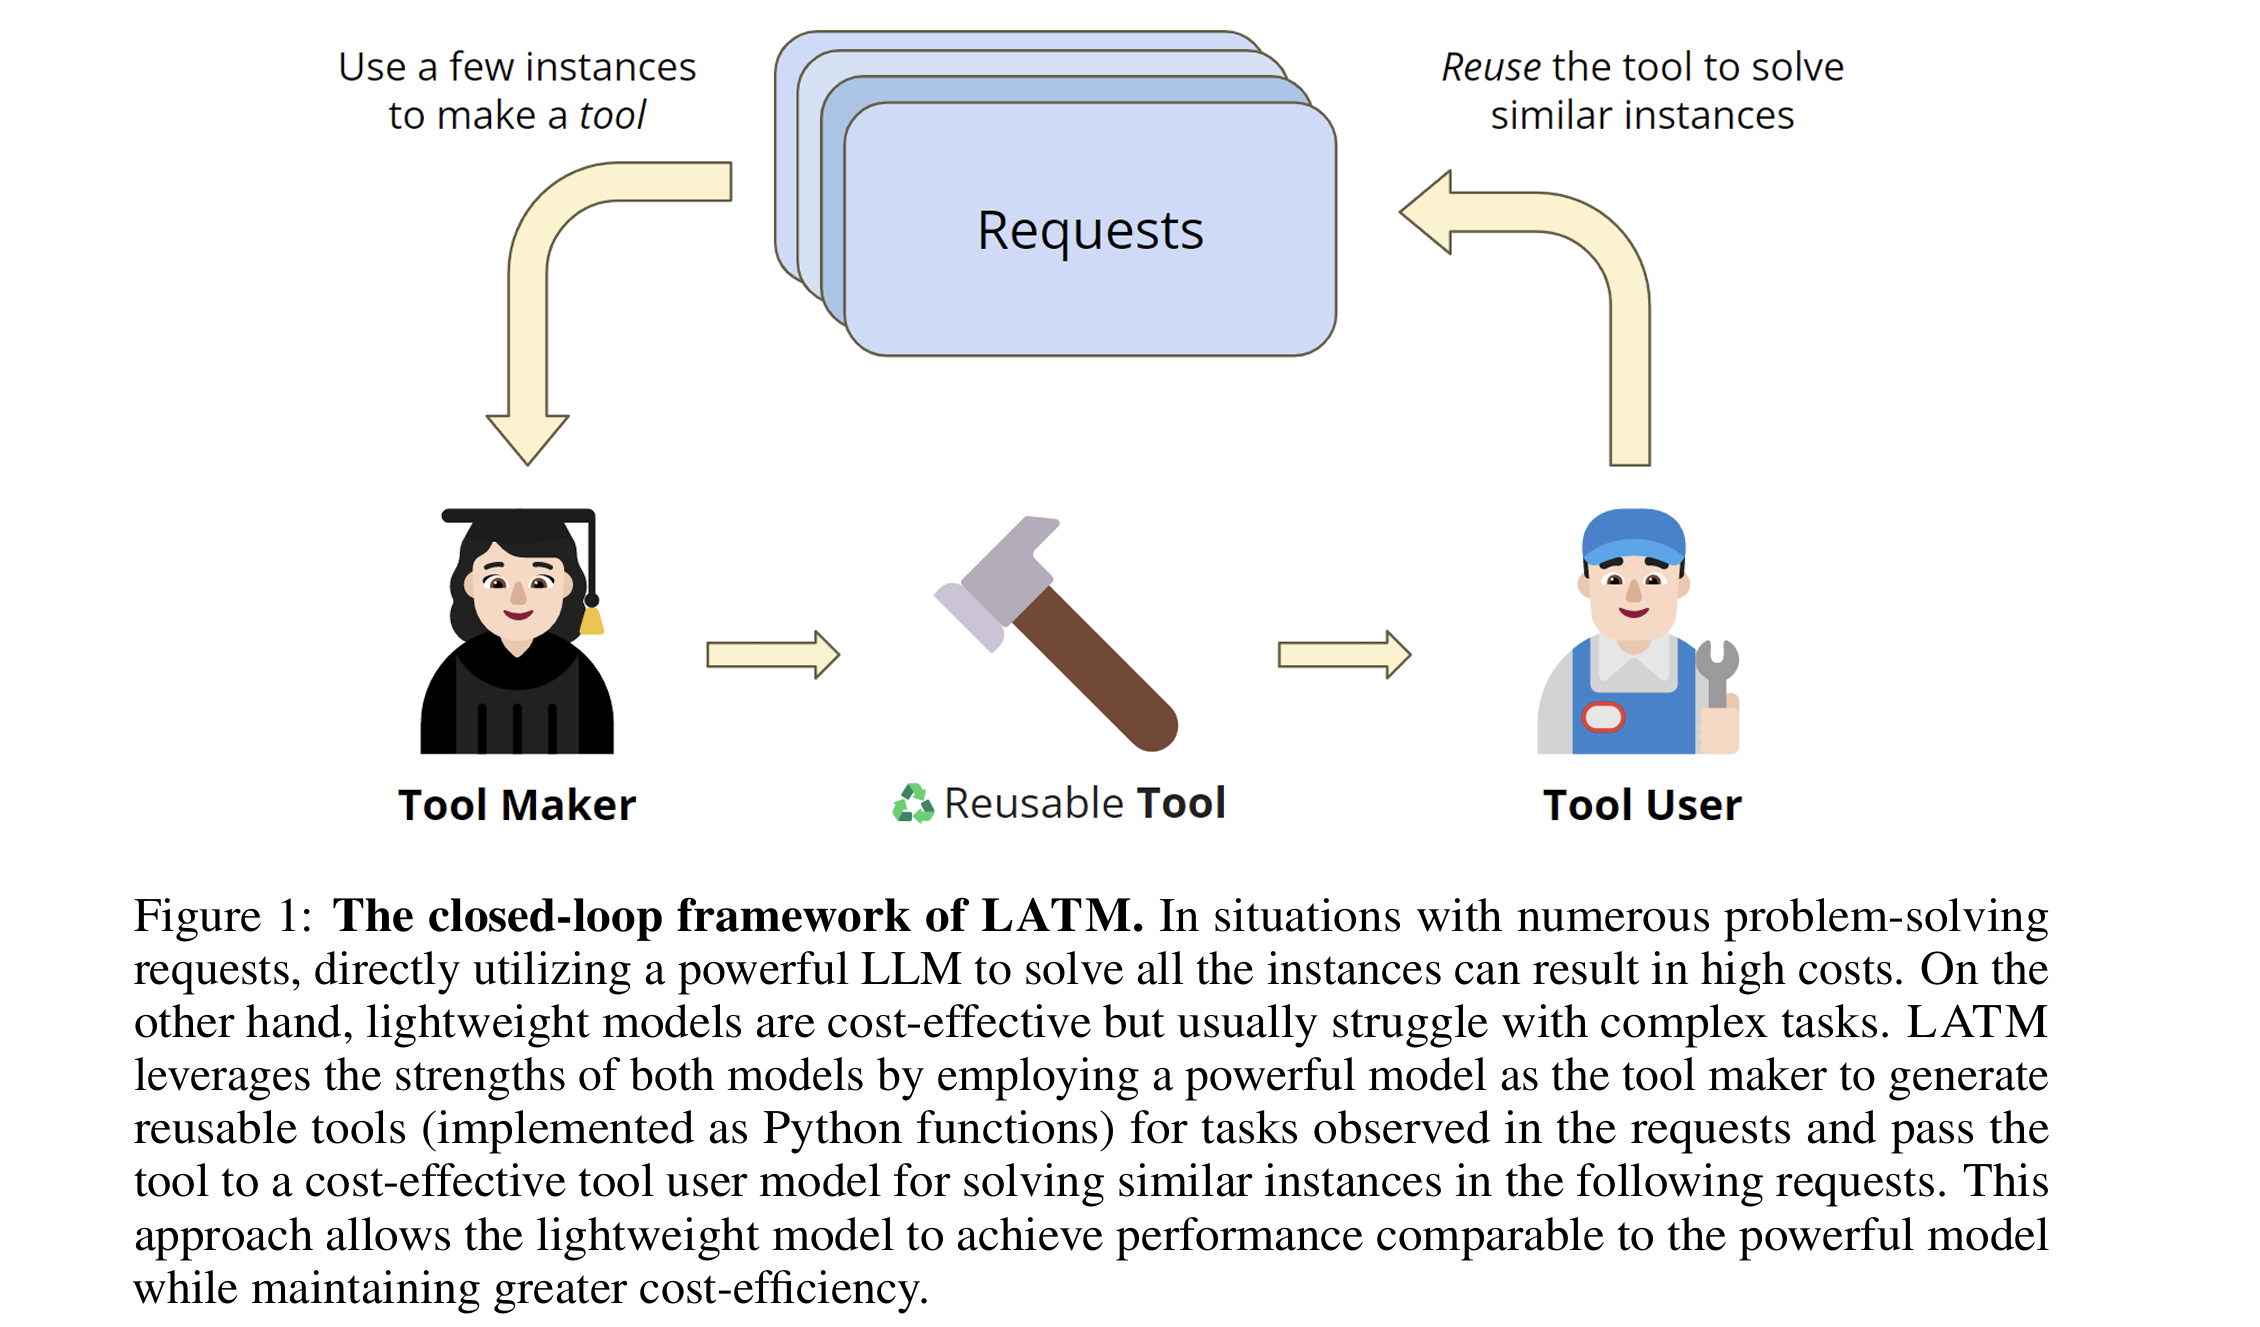
- Tool Users as Tool Makers (Cai et al., 2023): agents learn how to use provided tools (e.g., ECharts for visual agent). (Done)
- Trigger tools when the response requires it.
- Implement custom tools for tasks (e.g., DB queries, running tests).
- Integrate tool responses back into conversation context.
Future: allow users to build tools in real time; Tool Maker Agent saves tools for reuse (TODO)
Agent Flow Overview
- Chart Agent Flow = Code Agent → PGSQL Agent → Visual Agent
- Explain Agent Flow = Code Agent → PGSQL Agent → Explain Agent
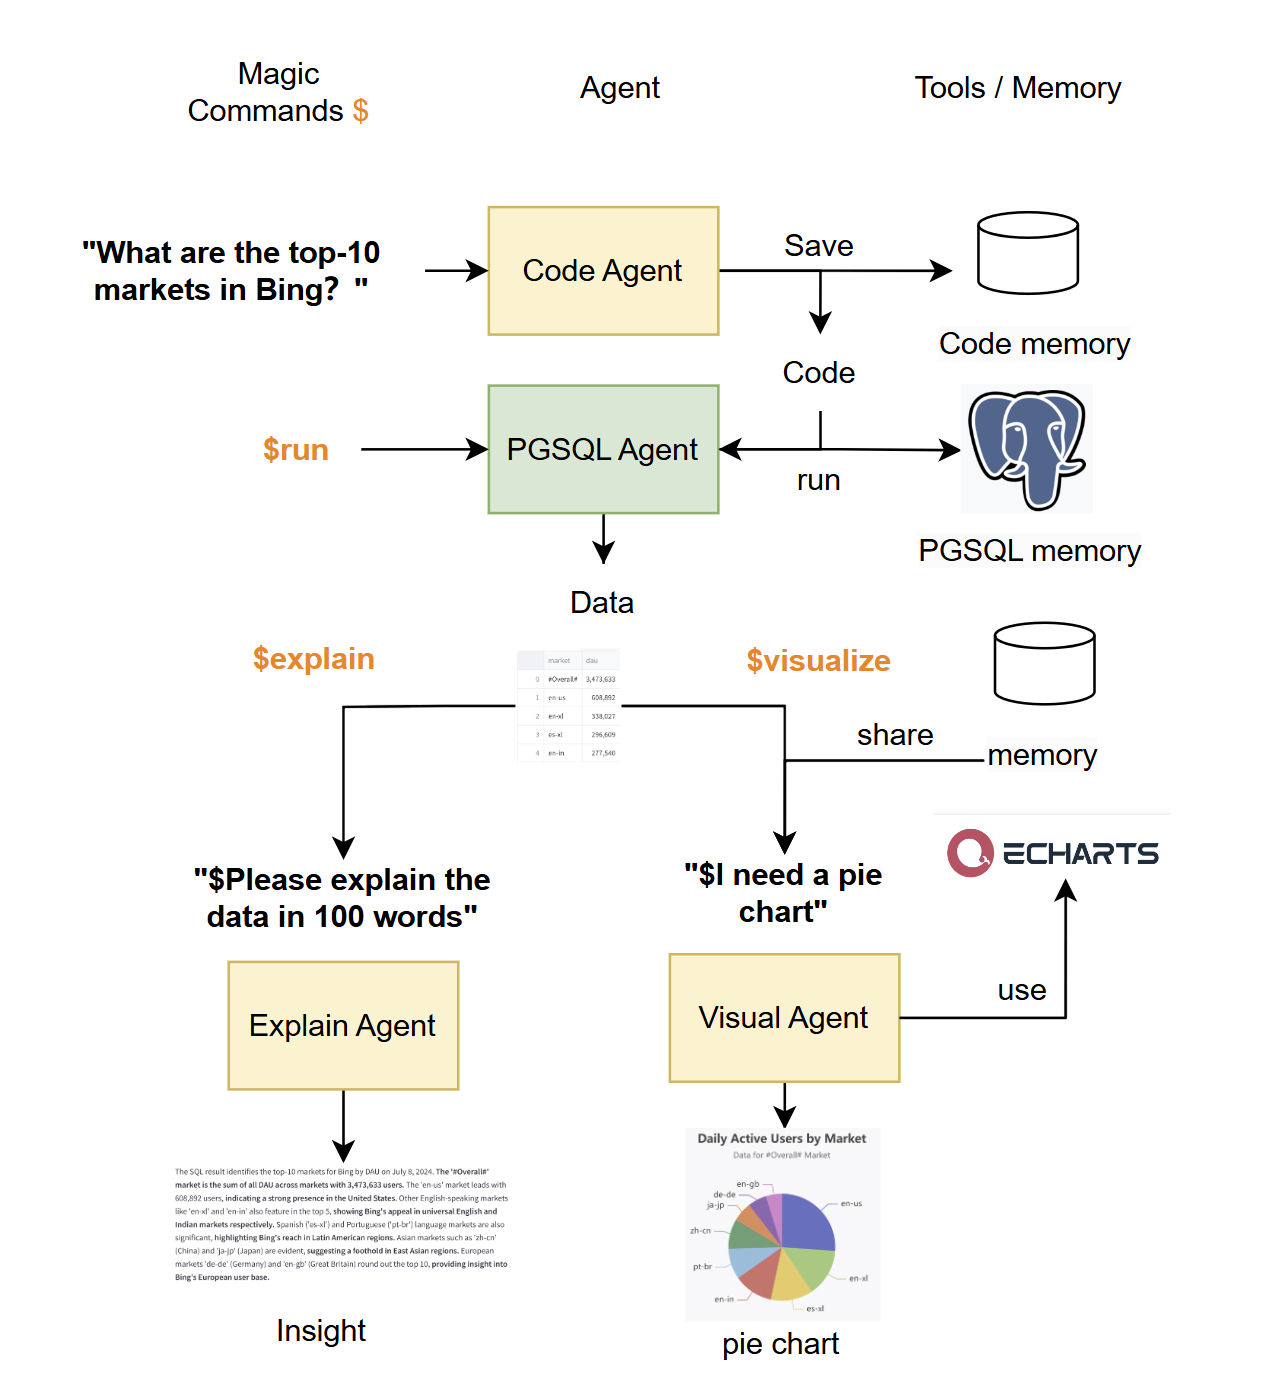
In the current DataJarvis, specific agents within an agent flow rely on magic commands for activation
(e.g., $run, $explain). In the future, DataJarvis will be able to
automatically generate agent flows with planning (task decomposition) ability.
Technical Architecture of DataJarvis
Frontend: Streamlit
Advantages
- Ease of Use
- Integration with Python
- Interactive Widgets
- Open Source
Disadvantages
- Performance limitations at very large scale
- Limited deployment options
Backend: Python on Azure Web App
Advantages
- Scalability
- Integration with Azure Services
- Security
- Developer Productivity
Disadvantages
- Cost
- Complexity
- Dependency Management
Development archive — June–July 2024
- 🔥 June 4, 2024: Azure credential for GPT-4 ✅
- 🔥 June 5, 2024: Scala generation explore ✅
- 🔥 June 8, 2024: Databricks-PGSQL explore ✅
- 🔥 June 10, 2024: PGSQL prompt for table understanding ✅
- 🔥 June 11, 2024: example for simple question pipeline ✅
- 🔥 June 12, 2024: grafana export SQL and transfromation ✅
- 🔥 June 15, 2024: prompt engineering for 2 stage generation ✅
- 🔥 June 20, 2024: Repos created + homepage ✅
- 🔥 June 21, 2024: PGSQL code executor ✅
- 🔥 June 24, 2024: Text2PGSQL agent for dau ✅
- 🔥 June 29, 2024: Text2PGSQL agent for miniapp ✅
- 🔥 June 29, 2024: Pandas dataframe renderer for chart interaction (csv, search, replace) ✅
- 🔥 July 3, 2024: Chart explainer for explain result from PGSQL ✅
- 🔥 July 3, 2024: Bar / Line / Pie ECharts supported ✅
- 🔥 July 5, 2024: Code editor ✅
- 🔥 July 10, 2024: Add about Page ✅
- 📚 July 12, 2024: chat with Grafana ✅
- 📚 July 19, 2024: Chat with Tool User ✅
- 📚 ToDo: Finetuning in BingViz PGSQL dataset for generalization (P0)
- 📚 ToDo: Visual agent flow webfront
- 📚 ToDo: Automatic agent flow
Tutorial & Example
PGSQL code generation
What are the dau of Bing-Android, Start-Android in recent 7 days?
Run PGSQL
$run
Explain the data
$explain$ please explain chart in 100 words
Draw EChart for data visualization
$visual$ please draw a pie chart.
Use Tool
$usetool$ Please generate daily check report on July 10th, 2024.

Plan
- Finetuning in BingViz PGSQL dataset for generalization
- Long memory: Graph RAG building for complex data query
- Query optimize for multiple query
- Tool build: Titan and Kusto support
- Automated Data Cleaning and Preprocessing Pipelines
- Real-time Analytics and Dashboarding: Speed optimize
- Cross-domain Transfer Learning
Related Work
- AutoGen | AutoGen: An Open-Source Programming Framework for Agentic AI
- yoheinakajima/babyagi: The Baby AGI uses OpenAI and vector DBs to create, prioritize, and execute tasks
- Significant-Gravitas/AutoGPT: A generalist LLM-based AI agent that can autonomously accomplish minor tasks
Reference
Issue
If you have any issues, please contact kexin.chen@microsoft.com or ckqqqq@bupt.edu.cn.